“We are starting to live in a world where getting more oil involves more energy, more effort and more expensive.” – Tad Patzek, President of the Department of Petroleum and Geosystems at the University of Texas.
You can’t get blood from a stone … can you?
Countries such as Venezuela, Saudi Arabia, Russia or Iran have the privilege of owning large quantities of easily extractable oil reserves, which means that the expenses that are used to obtain crude from their regions are not as high as in other parts of the world.
On the other hand, the US and Canada have been able to exploit their own resources with other more expensive extraction methods, a quest that turned into the origin of Shale Oil. This is a type of oil found in extracts that do not have sufficient permeability to be extracted with conventional methods. Through more expensive installations, it is possible to fracture layers of very deep soils that, with the help of chemicals, sand and water at high pressure, allow the hydrocarbons (in this case oil) trapped in the formations to flow to the surface.
The extraction of shale is not a method implanted in the 21st century, in fact, the first attempts go back to the beginning of the last century in the USA. The first fracture was recorded in 1947, and the first horizontal well was drilled in the 1930s, and from the 1950s both techniques grew by leaps and bounds. It was in the mid-1970s, at the initiative of the US Department of Energy and the Institute for Gas Research, that the fracturing had its commercial baptism when it was first applied to the extraction of shale gas. State participation was key so that, soon, the technique would be optimized and complemented with horizontal drilling.

THE RELATION BETWEEN THE PRICE OF PETROLEUM AND SHALE OIL
Shale platforms in the US have been able to adapt dynamically to the constant changes in oil prices.
The number of active shale platforms remained in a dormant state for almost three decades, but it was not until early 2008 that the price of black gold surpassed $100/barrel, which, added to a scenario of cheap credit concessions, Encouraged the investment in shale plants.
The following chart describes the number of platforms that have operated over the last few years in the US, based on the market price of the WTI.

In mid-2008, markets gave a clear bullish signal. The price of oil peaked at $135/barrel and after a few weeks fell again to levels of $36/barrel, due to the global financial crisis. Already in 2009, prices recovered again because of the Arab spring and did not fall until 2014, due to the following events:
- Excess supply at a time of weakening demand.
- OPEC decision to continue with the production increase.
- Decreased concerns about supply disruptions due to geopolitical causes.
- Appreciation of the US dollar.
The price level during those five years stimulated the investment of shale oil in the US, which meant an 800% increase in shale oil platforms in the US, from 200 to 1600 in the same period.
The fall in prices in 2014 pushed the restructuring of the sector in the US. However, the investment and the rhythm of production that they maintained during that period allowed them to reduce their import quotas, increasing their production rates.
Two years later, prices have not recovered, so OPEC and other world producers have decided to cut their respective daily production quotas to balance the excess supply that exists in the oil market. During this period of low prices, US producers have reinvented themselves by substantially lowering their operating costs, making them more profitable than ever in lower price environments .
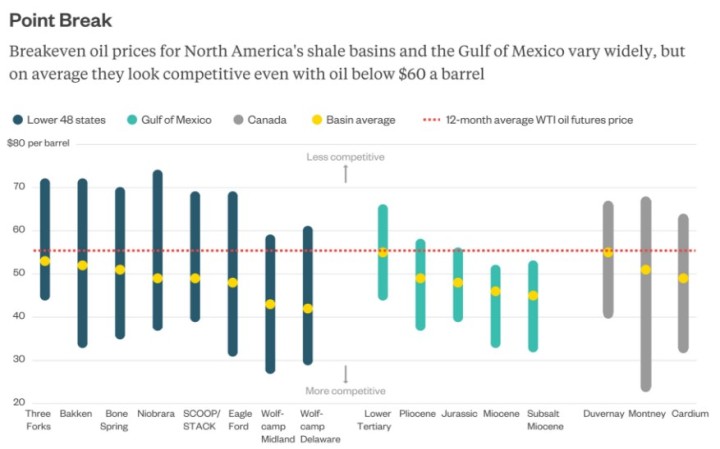
It is evident that not all shale oil platforms take the same crude oil price reference as breakeven (we refer to this concept as the price index necessary for the expected profitability of a shale platform to cover the costs and investment objectives of the same). The average price needed to be competitive in the market is already around $50/barrel.
As we have already explained, at higher oil prices, more investment attracts the sector, and therefore the number of active shale platforms increases. On the other hand, under the scenario of a cheaper oil price, investment moves away from the sector, and active companies focus on making the most expensive extraction techniques profitable.
The following image shows how the breakeven of the shale plants in the USA has evolved, which has enabled them to operate in lower price environments, ensuring their profitability.

TRICKY SITUATION FOR OPEC
In November 2016, some OPEC and non-OPEC countries agreed to cut production by a total of 1.8 million barrels per day for all of them during the first six months of 2017. This movement was aimed at stabilizing, during the First half of 2017, the level of supply and demand that had dragged the price of oil during 2016.
Shale has allowed the US to move from being the largest oil importer in the world to exporting 1.2 million barrels a day (more than some OPEC members such as Algeria, Ecuador or Qatar) because of the increase of its production, which has already surpassed 9 million barrels per day.

It is clear that the US is benefiting from the current oil landscape. The IMF concluded in 2015, that Saudi Arabia needs values of $ 106 per barrel, in order to balance the country’s budgets. The pressure to contain the fall in oil prices led it to cut 150% of what was agreed in the November 2016 agreement, as some countries like Russia, 4 months later, seem not to stick to the established quotas.
The production-cut strategy that could have helped Saudi Arabia (top OPEC representative) has actually been a risky bet. The lack of commitment that some signatory countries are demonstrating has led OPEC to lose market share (1.1%) compared to August 2016, a situation that has not gone untapped by the US and Iran.
The OPEC agreement provides for a meeting on 25 May, which will discuss whether or not to continue with the cut-off agreement and with what production quotas. Speculation of the moment and possible execution of an extension of the agreement (if any) could trigger crude prices again, allowing the US to attract more investment and raise its production quota again if necessary.
On the other hand, if this agreement were not to be extended and return to the previous production quotas , it would lead to market collapse, forcing shale platforms in the US to adapt to the new price scenario.
Adrian Gil | Energy Consultant
If you found it interesting, please share it!
Recent Articles