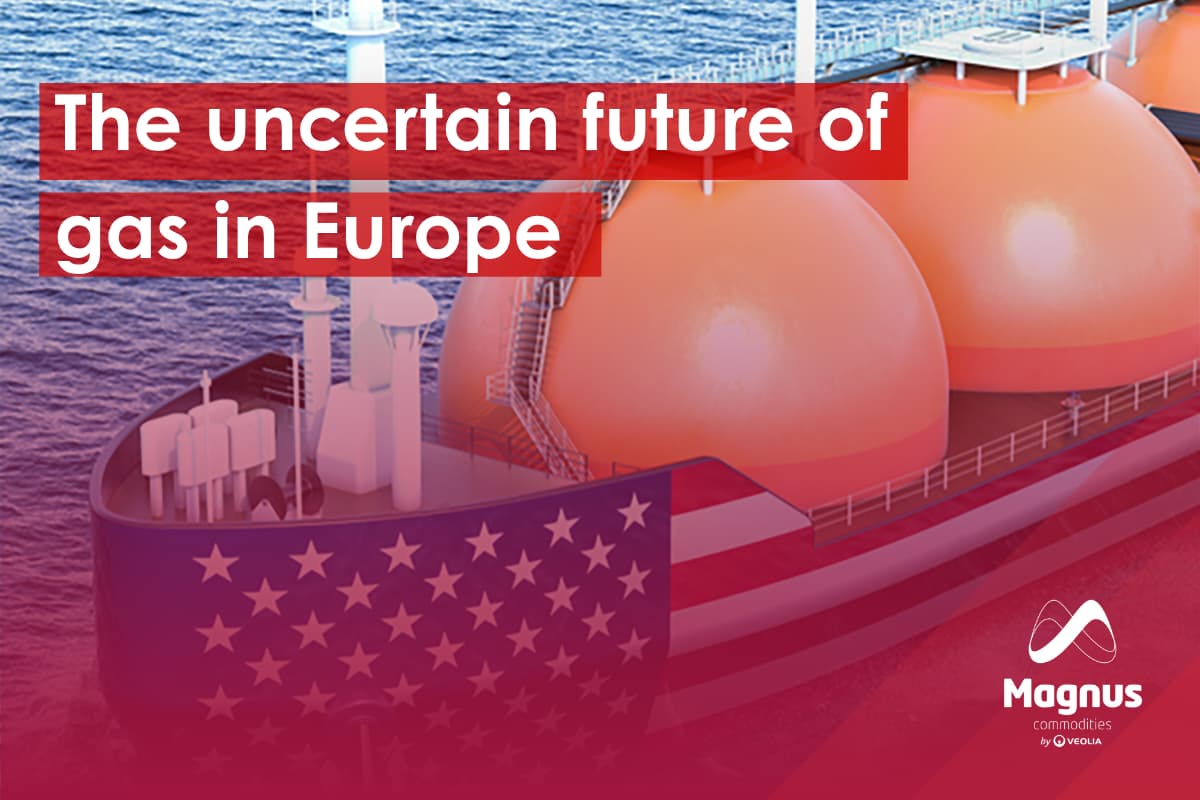
Spain has been characterized by having more natural gas (NG) inlets per tube than the liquefied natural gas (LNG) inlets. According to the latest Enagás report on the gas system, supplies in the form of natural gas (NG), 57%, exceeded in 2018 those of liquefied natural gas (LNG), 43%, for the sixth consecutive year. This mix of NG and LNG has resulted that we have a dominant supplier, Algeria, in these years which limits the price trip downwards:

Source: CNMC, Resolution MITyC 12/15/08 – Gas supply in 2018
Even though LNG is not even half of the mix, it is still very relevant. We owe him the great diversity of suppliers that the Spanish system has and the possible price opportunities that this entails. In June, China put a 25% tariff on US gas and Spain’s gas sector saw it as an opportunity for European prices. One opportunity more in the long term than in the short term as the international energy agency (IEA) foresees that in the next 5 years the United States and China will be the largest exporters and importers of LNG respectively.
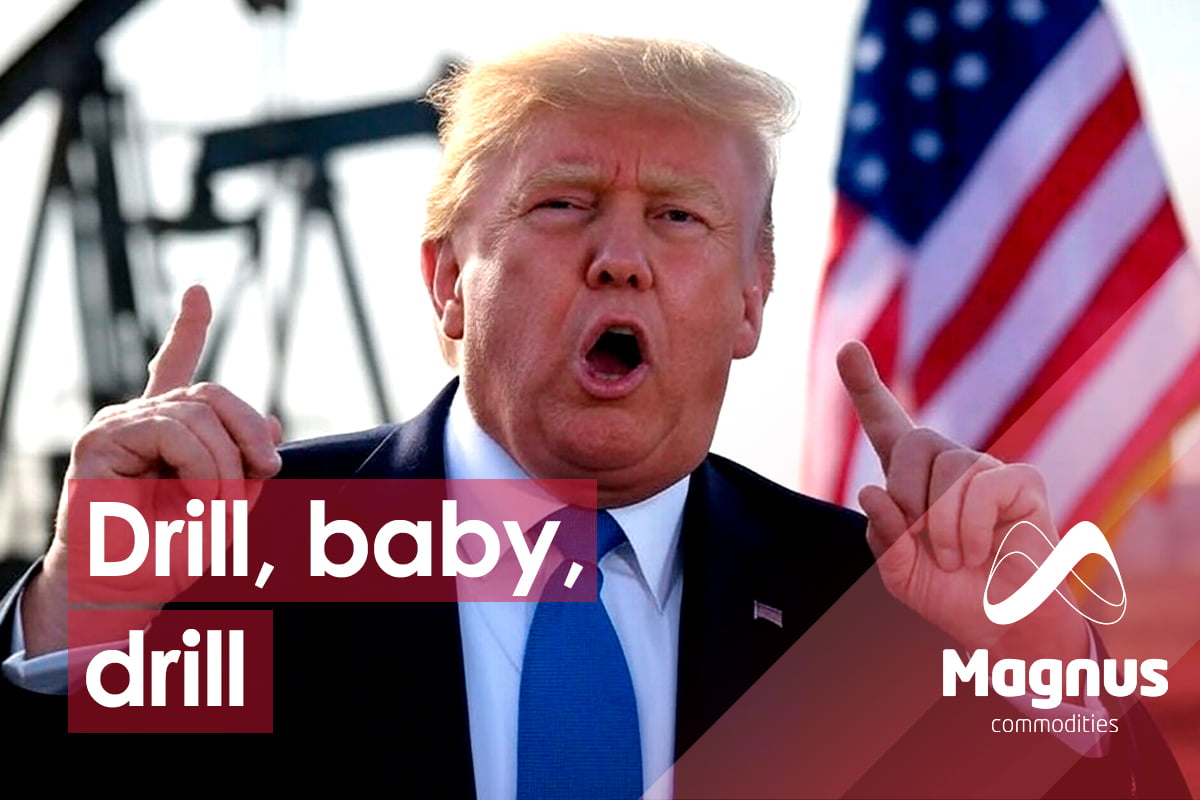
The increase in tariffs makes it less profitable for Chinese agents to purchase LNG tanks from the United States. It is not a theory, this happened last year when China applied a 10% tariff on fuel imports. As a consequence, LNG shipments from the United States to China were reduced by 68% in the second half of 2018. This trend has also continued this year where the largest LNG consumer is mainly supplied by Asian producers (Australia and Qatar). This situation leads to a greater LNG supply from the United States in other markets such as the European one. A situation that should help gas prices in Europe, and therefore in Spain.
In Spain, the largest gas consumers are in the Industrial sector according to the 2018 Enagás report of the Spanish gas system: Last year there was a national demand of 349.3 TWh of which the industrial demand accounted for 209.6 TWh, see 60 %. If one is an intensive gas consumer, one would like to find out how much competitiveness the US LNG brings to his market. Moreover, he would like to find out if this advantage is coming to him by conventional means (local gas supplier companies) or if he should consider bringing a cargo for him or for a group of industrial consumers. For this we will look at the costs of bringing LNG from the United States to Europe and in particular to Spain.
European Henry Hub and hub price differential
Natural gas, including LNG, is traded around the world in US $ per MMBtu (1 000 kWh = 3.412141633 million BTU / 1therm = 0.293297222 MWh). Contracts or financial instruments usually refer to amounts not less than 10,000 MMBtu. We will use this unit onwards.
Unlike other raw materials, NG and LNG do not have prices based exclusively on balances between supply and demand. There are several indices or patterns used around the world in order to determine the price of natural gas. Among the most important are: Henry Hub, NBP, TTF, JCC and parity with oil.
The Henry Hub (HH) is the name of the price point for future contracts NYMEX Natural Gas and is the reference market for gas in the United States. Another popular index is the JCC or Japan Crude Cocktail or Japan Custom-cleared Crude. Its use is mostly in Asia, particularly Japan, South Korea and Taiwan. Other indicators of similar characteristics are the National Balancing Point (NBP) of the United Kingdom and the Title Transfer Facility (TTF) of the Netherlands – the latter serves as a reference for the rest of the European market. In spite of quoting the same raw material – gas – these markets respond to a regional reality, being dependent on the variations of supply and demand on the territory as well as the fundamentals variations that rule them (use of gas for generation, use of gas for heating, climate, storage, net exporter, net importer, interconnections, etc.). This gas markets regional nature causes different price levels to exist. For example, in the case of HH and NBP, the fact that England is only an importer while the United States is mainly an exporter results in a positive differential between the two references.
If we take the difference between the weekly average of the HH M + 1 contract and the weekly average of the NBP M + 1 contract, we see that there is a positive differential of $ 3.03 / MMBtu:

Source: Reuters- EU-US GAS HUBS Difference ($ / MMBTU).
A positive difference that we also found between the JCC (or ANEA); TTF, ZEE and Peg and HH being respectively + $ 4.54 / MMBtu; +2.88 $ / MMBtu; +2.90 $ / MMBtu and +2.90 $ / MMBtu. The TTF and the Iberian Gas Market (Mibgas) keep a high correlation in such a way that the Mibgas M + 1 contract is equal to the TTF M + 1 + € 1.27 / MWh (difference between the settling price of 10-21-2019 session), see 0.41586 in $ / MMBtu. We can say that the positive differential between Mibgas and HH would be +3.29 $ / MMBtu.
These differences in the price of LNG in different markets make viable transport over long distances. In fact, an advantage of LNG is that it does not link consumption points with certain gas origins, so it greatly facilitates the diversification of origins, reducing the risk of supply, and increasing competition in the market. Under this premise, a priori there are price signals that motivate to bring LNG ships more to Asia than to Europe:

Source: Reuters- Price comparison ($ / MMBTU).
However, imports of liquefied natural gas (LNG) to the European Union from the United States have increased by 272% since July 2018. An increase that was consolidated when Brussels and Washington reached an agreement to relaunch their commercial relations after months marked by the taxes and aluminum. In Spain, LNG imports from the United States also increased significantly. If we remember the the CNMC’s 2018 gas supply mix and compare it with the following distribution graph, we will see how the United States natural gas quota has increased considerably in 2019:

Source: CNMC, MITyC Resolution 12/15/08 – Gas supply January-May 2019
LNG moves around the world following not only the price levels that occur in different gas markets but also the costs of taking it to those markets. Costs that unravel from the stages that make up the LNG value chain.
The LNG value chain USA to Spain
In LNG there is no supplier’s limitation, and it depends only on an economic issue: where it is more profitable to sell LNG. This profitability is based on the price that each part of the LNG value chain has, and specifically in the liquefaction stage. It is the factor with the greatest impact due to the constant increase in the construction costs of these plants, especially iron

Source: LNG value chain and cost at the break-even point made by I&EC according to IGU, International Gas Union World LNG Report 2017 and Songh, Songhurst, B. LNG plant cost escalation; The Oxford Institute for Energy Studies, 2014.
Regarding the differential price mentioned earlier between the Mibgasand the HH, the costs of stages 2, 3 and 4 must be added. The cost of stage 2 is around 2. $ / MMBtu according to the data published in the reports from Cheniere’s, the largest LNG seller in the United States. For the LNG transport costs of stage 3, the values estimated by the market will be used according to a calculation method named the “voyage cost”. This cost takes into account the following aspects: Type of ship; Load and ballast speed; Use of fuel in the load and ballast; Cost of Boil-off; Transit costs through the canal of Sweden and Panama when it touches; Chartered fuel cost; Cost of charter the ship and Transfer cost among others.
Below we present the travel costs from two terminals in the United States to various destinations. We can see that the costs are lower for European destinations than for Asian destinations confirming the increase in imports.

Source: Reuters- United States exports to Spain.
Now we only have to see the cost of stage 4: regasification. For this we will take as reference the cost estimated by market experts for the Zeebrugge being the physical analogue to the TTF; European market reference. This stands at $ 0.24 / MMBtu. By adding the costs of stages 2, 3 and 4 to the positive price differentials of the TTF (+ $ 2.88 / MMBtu) and the Mibgas (+ $ 3.29 / MMBtu), we would have a differential of -0.144 $ / MMBtu and + $ 0.266 / MMBt respectively. This translates into a loss to the TTF market of – € 0.44 / MWh and a gain to the Mibgas market of € 0.81 / MWh.
Note that the costs applied in relation to the LNG value chain from the United States to Europe are average values and there may be variations compared to the present. That said it seems that the results of the differences are reasonable considering the countries of origin of the LNG imports from the Netherlands and Spain during these months. The following graphs show how imports from the United States have fallen in the Netherlands while still exist in Spain:

Source: Reuters- Imports from the United States to the Netherlands

Source: Reuters- Imports from the United States to Spain
From the graphs Add we also observe that the United States is not one of the largest importers to Europe in the short term landscape.
In conclusion, although the arrival of LNG from the United States has been noticed in Europe, the impact it may have on price improvement remains limited as it is not a supplier with a relevant presence yet. Along these lines, the decrease in gas prices in Europe is further supported by a well-supplied system due to the mild winter of the first quarter of 2019, and a global LNG oversupply since infrastructures were increased around the world to meet China needs. Last but not least, the margins of importing gas from the United States to Spain exist but they are magnitudes that can disappear quickly as has happened to Holland. Even so, if someone were still interested in taking a boat from the United States to bring it to the port of Bilbao, they should consider how to inject it into the system. In other words, what figure needs to convert into in order to manage the gas getting at its supply points: Go with someone who is already in the wholesale market? Become your own agent to participate in the wholesale market?, or Join with others and make a group to participate in?
If you found it interesting, please share it!
Recent Articles