Things change. That’s just how it is. Sometimes they change to an outcome which is favorable to us, but other times that outcome is far away from our expectations. Case in point: the Spanish daily power spot market (emphasis on daily). Anyone with half an interest in the matter will notice two-things:
The rather obvious and painful one is that the market is more expensive. This fact alone, for a company without a risk management strategy, is very bad news indeed – so much so, that a surprising amount of bad news have already been written about it.
Nevertheless, there’s a second fact which is way more surreptitious and is the underlying of the first – the market is rather flat. That means usually cheaper hours are no longer that cheap. OMIE’s price volatility has been decreasing.
Vanishing whiskers
Just look at the chart below. In it we compare 3 random weeks of 2018. Just like before, the most apparent bit is that last week’s (W27) boxes are higher in the chart than the previous ones – which basically means hourly prices were more expensive.

Fig.1 – Box Plot of OMIE Daily Market for W5, 18 and 27 of 2018 (for more information on how to interpret this chart click here)
Now look at how the boxes are getting more compact and the horizontal lines inside them at the same level. This means that prices per hour are all very similar to each other.
Now look at how the vertical lines outside the boxes (whiskers), are progressively getting shorter, particularly the lower ones (which indicate that when hours are cheap, they are real cheap). There’s less and less cheaper hours.
How surprising is it
Surprisingly enough, not much. Let’s look at the following chart.
Standard deviation (SD) is a common measure of volatility, since it quantifies the amount of dispersion (or variations to the mean) of a data set. The next chart plots the SD in hourly price of all Mondays, Thursdays and Saturdays from 2015 onwards.
The shadow behind the curve shows you the range of SD values (minimum and maximum), while the darker curve shows the weekly average of said SD’s.
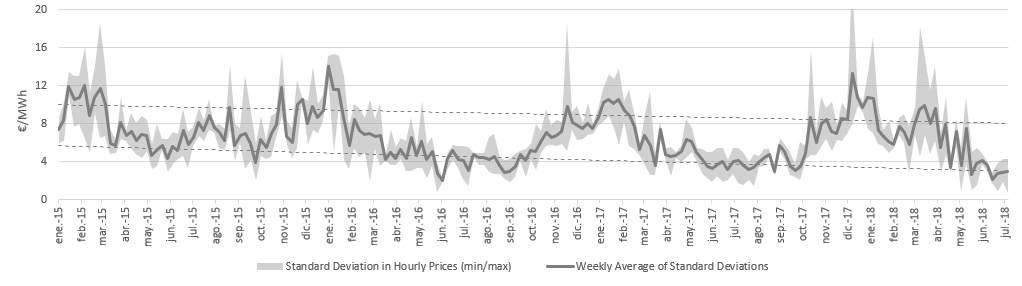
Fig.2 – Daily standard deviations of OMIE Daily Market’s hourly price for Mondays, Thursdays and Saturdays
As you can see, in a yearly basis and roughly always mid-year, market volatility decreases significantly. So much so that, in both 2016 and 2017, this happened at the levels we have now (lower than 5€/MWh). Nevertheless, there’s an apparent downward trend in market volatility, which may mean that this year, the effect might be slightly more pronounced than in previous years and, if the trend continues, 2019 will be even more so.
Also interesting is the fact that. Although we are witnessing a flat market, volatility was particularly high in both this year’s transition, and during the Q1-Q2 transition.
The caveat of Marginalism
OMIE, like many other energy markets, is a marginal market. What does this mean? Well, it means many things but, practically, it means that the price of power is set by the most expensive seller who gets a buyer. Even if you auctioned your energy at 1ct€/MWh, if someone else auctions at 100€/MWh and someone buys it, then you too get 100€/MWh.
Nevertheless, it’s an imperfect market:
• as power is a basic requirement of everyday life, demand cannot go uncovered even if the price is astronomical;
• the suppliers competing in the market are very different. For example: nuclear power and wind power have almost no variability in their costs, nevertheless a coal or gas-fired power plant are both tied to specific commodity markets;
• the technological and investment requirements are very different, consider the previous example of nuclear vs. wind power;
• the amount of investment required and the very history of the system, makes for very few real sales agents, even among different technologies.
So what’s happening
If consider and believe that the Spanish power spot market is in perfect balance and harmony, the mystery of the vanishing whiskers means one of two things: either the same type of technology has been matching all hours, or all technologies pursue now the same selling prices.
For this exercise, let’s consider the metrics given by REE’s PBF (day-ahead basic TSO program) – which has a more direct relationship with the OMIE daily market. Looking into it, we see that in W5, predicted demand was around 5TWh, while in W27 it was lower, close to 4.7TWh. Nevertheless, in W5 forecasted eolic energy was almost double than on W27. The cheaper W18, had a good prediction for eolic (1TWh) but much lower overall demand prediction (4.3TWh).
The decrease in available wind power during summer associated to higher demand, are most likely the major drivers of recurrent low price-volatility in this time of year. This fact alone may be enough to try and justify the higher prices of W27. But it still doesn’t answer the question since, given the knowledge that hydraulic energy tends to occupy the same price band at the higher end of the spectrum, why isn’t there more distribution of prices (fig.3).

Fig.3 – Distribution of OMIE daily market hourly prices in W5, W18 and W27 of 2018
If we combine the information from the previous chart, with which technologies defined the prices in those weeks we get the following enlightening results.

Fig.4 – Distribution of marginal price-setting technologies for the OMIE daily market in W5, W18 and W27 of 2018
- The most obvious thing is how conventional technologies have increased their marginal cost, which raises the question of whether, or not, this increase is justified;
- The second and interesting thing, is that usually it’s hydraulics that sets the expensive price of OMIE but now, it’s being joined by “renewables”;
- The third most curious thing is how standard hydraulic generation marginal cost changes in a way totally unrelated to the state of hydroelectric potential, but in perfect correlation to the week-on-week changes of remaining technologies;
Regarding the first point, we must take into consideration all mentioned above regarding marginalism and the imperfection in competition within the energy sector. Nevertheless, let’s look in to some key features. Between W5 and W27:
- Iberian gas spot prices (just as a reference) went down significantly (>5€/MWh)
- the Iberian gas forward market (again just as a reference) went up significantly (>5€/MWh)
- EU reference Coal (API2) went up slightly since February
- EU emission rights “spot” (secondary market) almost doubled in price (>7€/MWh)
- EUR is down 7% against the USD
- Crude oil and freight costs are up
- Consumer confidence is slightly down, and a trade war is in full effect
It’s, to an extent, understandable that conventional technologies increase their marginal cost of operation and that renewables, at least the real ones, have incremented their opportunity cost in this time of year (there’s your vanishing whiskers).
Also, given this scenario, and that hydraulic power has been sitting on the 55€+ price band for some time now, it is now setting the price of most daily hours, leading to a reduced price-volatility (there’s your flat OMIE).
It’s a time of uncertainty, not just in the behaviour of the world’s largest economy, but also in Asian demand for gas and coal and European availability of nuclear energy and emission right’s price. Nevertheless, the trending view in energy financial markets is bullish. If the pattern seen in past years is to be believed, we’re in for a very expensive year (perhaps even years).
Nevertheless, there’s a great deal more questions to be raised regarding point #3 which go beyond daily market prices and flat price curves, which are rooted in the very way the market is modelled. I’ll leave the speculation to the reader although, in the words of the new minister for Ecologic Transition – Teresa Ribera:
“It will be required that we rethink the market, the price-definition system, the rules, the operative programs of the different agents, the debut and exit of new and old actors”.
Hugo Martins |Analyst
If you found it interesting, please share it!
Recent Articles