2021 starts with the hangover of a 2020 year to forget and a meteorological phenomenon that this winter has shaken the European gas markets. And by the way, it has contributed the wholesale power market break price records as well. All of this ended up in gas price levels never seen before (both for high prices and low prices achieved).

Source: MTech
And yes … this same situation has been experienced throughout Europe, so I would like to take this opportunity to chase away any shadow of victimhood or criticism regarding the behaviour of the Iberian market compared to our European neighbours. In the attached graph we can see that they have gone through the same circumstances and have reacted in the same way:

Source: MTech
Structurer of the European gas market.
To understand a bit what has happened in the gas market, I think it is important to contextualize and share with the reader some literature on how it works. General speaking there are two main sources of natural gas: own resources (or internal production) and external resources (Gas pipelines and Liquefied Natural Gas). In order of importance, we can say that gas pipelines are the main source of gas resources for Europe (especially the Russians), then comes internal production and lastly (although catching up the second place) we have LNG.

Natural Gas Import by source (2017-2020)
- Internal production. Let us remember that this solid market was born back in the 1960s with the discovery of the Groningen field in the Netherlands, followed a few years later by the first discoveries in the British North Sea area and the one of Norway within the decade of the 1970. At the end of the 20th century is an industry developed that today represents more than 25% of the European energy demand. A huge export business was created through a series of pipelines supplying gas to both continental Europe and the UK.
However, these equities are in clear decline in contrast to the substantial increases anticipated in gas demand over the next 30 years. The production of the Groningen field is decreasing and should be completely finished by mid-2022 at the latest. - Imports. As we have already indicated, despite the rich reserves of Natural Gas in northern Europe, most of the volume comes from imports through gas pipelines or by maritime transport of LNG to our liquefaction plants.
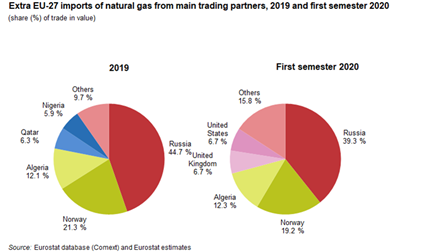
Main sources of Natural Gas imports to Europe
- Gas pipelines (Canalized Gas). Russia, Iran, Azerbaijan and Algeria are the regions that feed the European continent through gas pipelines. With a greater impact, gas of Russian origin is the one that impacts the European markets the most and therefore any news regarding trade agreements or energy policies with this country are of great relevance.

Main supply routes for piped gas
While very small quantities of Soviet gas had originally been exported to Poland since the late 1940s, the idea of large-scale imports of Soviet gas into Western Europe seemed unworkable and unwise. The focus of Soviet natural gas production was shifting from the Volga / Urals, the North Caucasus and Ukraine to Siberia, which would require additional transportation of several thousand kilometers. However, between 1970 and 1980, Soviet gas deliveries to Western Europe increased from 3.4 Bcm to 26 Bcm. And in 1990 gas exports had already reacched 109 Bcm.
Currently there is a great controversy surrounding the completion of the Nord Stream 2 gas pipeline project that would add 55 bcm/y of Russian gas to the European market. The project was blocked due to sanctions imposed by the US due to the risk of Germany’s excess dependence on Russia and the potential blockade of the European LNG market to the American cargoes. The European Commission has its own concerns as well. New capacity could reduce the use of existing connections and would be replaced by a “dominant single transport corridor”.
On the other hand, the trans-Mediterranean gas pipeline from Algeria through Tunisia to Sicily began to flow gas to mainland Italy in 1983. The GME gas pipeline from Algeria through Morocco to Spain and Portugal was completed in late 1996. Since then, the capacity of the trans-Mediterranean line has increased substantially and the GME capacity will increase.
- Liquefied natural gas (LNG): Even before Dutch pipeline gas exports started flowing, the first LNG ships were arriving in the UK and France from Algeria. Over long distances or in waters too deep to install pipelines, LNG can be a very convenient alternative to piped gas. However, in the early 1960s, the technology of liquefying gas to minus 161 degrees Celsius and loading it onto ships to re-gasify it upon arrival was very expensive.
LNG receiving terminals were built in the United Kingdom, France, Italy, Spain and Belgium, and later in Turkey and Greece, but the growth rate of LNG in Europe was modest until the early 1990s, when the new Technological developments made LNG more competitive. This led to the rapid construction of new regasification terminals in Europe and plans to develop new terminals in both northern and southern Europe.
 In the case of Spain. With seven regasification plants – six in operation and one pending entry into operation – it is the leader in Europe in the number of gas infrastructures. The Spanish Gas System has a total of 25 storage tanks, 8 berths and the capacity to receive methane tankers of up to 270,000 m3. The entries from regasification plants to the System showed a significant increase of almost 57% in 2019 compared to 2018. Total regasification reached 227,888 GWh and the notable increase in the Sagunto plant stood out, followed by the Cartagena, Bilbao and Huelva.
- Gas pipelines (Canalized Gas). Russia, Iran, Azerbaijan and Algeria are the regions that feed the European continent through gas pipelines. With a greater impact, gas of Russian origin is the one that impacts the European markets the most and therefore any news regarding trade agreements or energy policies with this country are of great relevance.
What has happened in 2020 and the beginning of 2021?
2020 on the way to the lowest prices ever…
- Since the beginning of the year, the Covid-19 coronavirus began to spread first in China, resulting in containment measures significantly reducing the demand for energy products.
- On March 6, 2020, the OPEC + countries could not agree on the adjustment of production. Measures that, in combination with reduced demand, led to an unprecedented drop in crude prices in the first quarter of 2020 (from USD 66 / barrel to USD 18 / barrel). The general fall in the prices of energy raw materials and the stock market also affected the gas markets.
- EU gas production fell 23% year-on-year in the first quarter of 2020 and this led to a greater dependence on gas imports.
- Russian gas pipeline supplies continued to be the main source of EU gas imports.
- The share of LNG increased to the highest level ever (28%) in extra-community gas imports. Price differentials between different regions practically disappeared amid the downward trend in prices in well-supplied global LNG markets, allowing for an abundant influx of LNG into Europe. Europe could also benefit from lower shipping costs, due to its geographical proximity to the main LNG supply sources, namely the US, the Middle East and Russia. Some LNG shipments were redirected to Europe in February, due to low demand in China after the introduction of the lockdown measures. In the first quarter of 2020, the United States maintained its position as the leading source of LNG supply for the EU, securing 30% of total imports, ahead of Russia (22%), indicating intense competition between these two countries for the EU LNG market.

Gas prices in Europe were affected by the abundant supply of LNG to Europe and by intense stock removal activity. On the demand side, a mild winter climate, which reduces heating needs, the high share of renewable energy in electricity generation in the EU, which reduced the need for gas in the electricity sector, and with the introduction of lockdown measures in March 2020, industrial gas demand fell as well. In the first quarter of 2020, the prices of European centers fell between 40% and 50% compared to the year. Internationally, the price differentials between different regions decreased amid the downward trend in prices.
2021 on the way to the highest prices ever…
- 2021 begins with a clearly cold weather phenomenon, which has led to a substantial increase in the demand for fuels both in Europe and in Asian markets.
- The gas needs in China and Japan are so great that they are disrupting the entire LNG market, so much so that many ships with other destinations are being diverted to the main ports with regasification plants in the region, where by the way the price is skyrocketing.
- Algeria is having problems when it comes to processing gas and is causing delays in the supply by tube, not only with Spain but also with Italy.
- Along with the cold it seems that there has clearly been a kind of overconfidence by the big Asian buyers. Their gas forecasts for the winter period did not cover the real market needs that they had secured and has pushed the markets to all-time highs.
Note: It seems that also the gas market it is subject to the law of the pendulum, and its prices can swing from one extreme position to another in the opposite direction. These last 12 months have been a nightmare for all market prediction models…
Alejandro De Roca | Energy Consultant
If you found it interesting, please share it!
Recent Articles