Is in human nature the necessity to have a “logic” explanation for everything that happens and in the energy market that’s no different. As normal, one tends to rely on the fact that an action triggers a reaction and the more informed you are about those actions, the best you can (try to) “predict” their reactions.
Well, the energy market has been doing a great job in contradicting this reasoning. Energy commodities, as all the goods, register price variations according to the supply/demand situation and speculation. Some more than others rely on these two factors and buyers and sellers decide upon that principles.
2018 is being an atypical year for energy, not only because of the price ranges witnessed but mainly due to its behaviour against the market fundamentals along the year which increases the uncertainty around the following months and, more important, 2019.
On the following lines, we will try to understand the movements of the market in the first half of the year and understand the key factors that could affect the upcoming months.
Weather
2017 was a really dry year, especially in Southern countries such has Spain and Portugal but the lack of rain caused important falls in the water levels across Europe, affecting populations and agriculture as well as limiting the energy production from hydropower sources. To help (or not) this situation, the winter was especially dry, cold and long demanding more energy for electricity and for heating.
The cold temperatures were prolonged until the end of April but at least the rain came and came in full power. In Portugal for example, from December of 2017 to March of 2018, the country passed from the situation on extreme drought to healthy wet and the water levels achieved the maximum levels by April.
In Spain the recovery took more time but, as shown in the Figure 2 the Hydroelectric reserves increased importantly after March and has been at healthy levels since then.
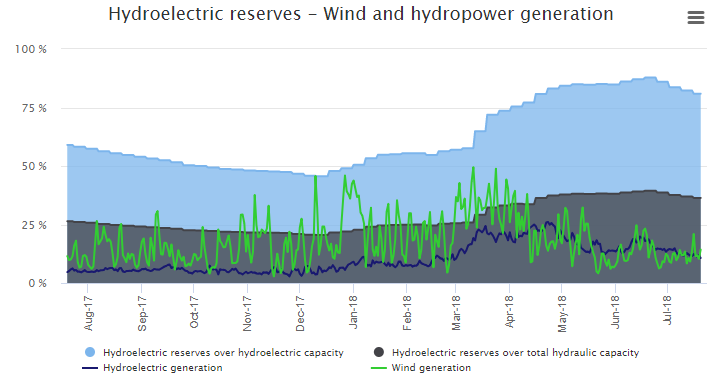
Figure 1 – Hydroelectric reserves & Wind generation evolution. SOURCE: MTECH
Natural Gas
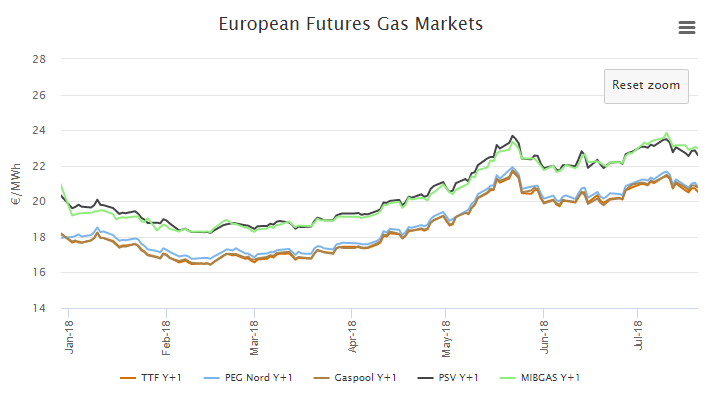
The harsh winter experienced in the North Hemisphere pressured seriously the gas prices across all the markets in Europe and Asia.
The Mibgas, that was mainly used as an adjustment market, registered significant rises dragged by the same behaviour of the rest of the European gas hubs.
The TTF, the Dutch gas market that is used has reference in Europe struggled in the first half 2018 with the following factors:
- Its major gas field, Groningen (the largest gas field in Europe) had to decrease its output capacity in winter due to earthquake episodes;
- The number of LNG tanks bringing gas to European docks reduced significantly due to a high demand from the Asian market affecting Europe’s supplies during the cold snaps experienced in February and March;
- Disruptions in the interconnections between the UK-Norway and Norway-Europe also had great impact on spot prices.

Figure 2 – Evolution of SPOT Gas prices. SOURCE: MTECH
The “injection season” was delayed by one month and the demand for gas in an already tight market led to a considerable depletion of the strategic reserves across Europe with the injection season starting in late April with just 50 TWh equivalent of natural gas left, which corresponds to 10% of the total capacity of the reserves.
In “normal” conditions the Year ahead (YR+1) product for Natural Gas correspond to an average of Spot prices where the months between September and March present prices above the YR+1 and the months between April and August present prices under theYR+1. However, in 2018 the Calendar product for 2019 has been quoting below the Monthly Average prices since January. This “anomaly” is related to the current pressure in the gas market during the current summer period due to the following factors:
- The “injection season” is being the main focus of the market with the majority of the countries trying to recover the strategic reserves at healthy levels towards the next winter. Nevertheless, the levels are still under the 50% showing 30 TWh below 2017 levels;
- Healthy levels of gas imports from Asia, especially from Japan, S. Korea and China.
- Bigger participation of gas in the energy mix in most of the European countries due to low wind availability and due to a better opportunity market cost against direct technologies such as coal.
- Higher than expected flows in centre and Northern Europe due to a hot summer forcing more gas demand for cooling purposes.

Figure 4 – TTF Spot vs. TTF Y+1. SOURCE: MTECH
The high prices of Spot natural gas in most of the European Hubs are also dragging upwards the future prices, but also the strong prices of coal and oil are influencing the 2019 prices.

Figure 5 – Evolution of Coal API2 Y+1. SOURCE: MTECH
The coal market resuscitated in 2016 and the upward trend gained significant relevance in May of 2017 mainly due to a shortage of supply and a rise of the Chinese appetite for coal imports after slashing its domestic output (find why here).
Again, the long dry season experienced in Europe gave another opportunity to the coal to reborn and to participate steadily in 2017/2018. In Spain, coal contributed more than 8% in the energy mix and in Portugal the coal thermal power plant that was about to close participated for 17% of the country’s mix.
Despite this, coal industry is facing an enormous enemy: World General Phase out with European Union leading the way aiming to slash considerably its reliability on this commodity in the coming years. Countries like Portugal, France, Italy, and others already set their total phase out dates until 2030.
Until there, coal will also rely mainly on the appetite of China and India: the first intends to substitute a huge part of coal for gas a renewable capacity in order to find climate change and control the internal emission levels (great article here). The second wants to boost its internal economy by focusing also on coal but investing in most efficient thermal plants. On the supply side, Trump administration is making efforts to boost this industry despite several movements against it.

Figure 6 – Evolution of EUAs Y+1. SOURCE: MTECH
Probably the underdog character from a movie, the ETS market revitalised last year and is coming at full power to become one of the most important and relevant commodities for power and natural gas in Europe, especially after 2020 when the fourth package kicks in. All started with rumours from different countries such as France and the UK that started threatening to impose a floor price in their countries’ emissions to control the CO2 emissions to align with the COP21 commitment. Even Germany mentioned this possibility, despite the difficulty to materialize it since the country relies heavily on coal. After the first boost came the leverage: The approval of the ETS market reform set new and more ambitious goals towards an European Union more sustainable with objectives of reducing the emissions allowances in the following years and cutting some free allocations gradually. The EUAs jumped from the 6€/tone to the current 17€/tone in less than one year and recent news forecasts a 100 €/tone in the next decade.
This evolution had a tremendous impact in the power market and, by consequence in the gas market or in the other way around. In fact, high prices of EUAs in the first stage benefits gas against the coal, especially with the current coal prices once that burning coal becomes more expensive than burning natural gas. However, in a second stage It will hurt the power market since burning gas will become a lot more expensive than before. So, the thermal and controllable and (at the same time) competitive source of energy will be restrained to nuclear hydropower.
Nuclear
France is again putting at risk the winter of 18/19 due to the recent incidents and failures regarding safety checks on its nuclear plants. According to recent reports, 30 out of 58 nuclear reactors will have to be evaluated before the end of the current year and this can affect largely the supply across Europe, reliving the nightmare experienced two winters ago. To find more about this you can check “France: Europe’s Energy Plug”.
In Iberia, debates about the phase out of coal and nuclear have been occurring more often in order to develop the energy transition plan of the country. Currently three nuclear reactors are expected to end their lifecycle by June/July of 2020 and debates have being conducted to figure if it’s a feasible decision. In terms of 2018, 3 of 8 nuclear reactors were off-line, affecting the energy mix in the peninsula. Vandellós II, that was down since April, went back online on July 24th but it only lasted 72 hours before being forced to stopped again due to technical issues.

Figure 7 – Spanish Nuclear Participation in the Energy Mix. SOURCE: OMIE
Power
The power prices obey to several fundamentals and most of those were described and analysed in the past paragraphs. But the Iberian power market came to discover another important and less “intuitive” argument that explains its recent movements. I am referring to the behaviour of the Spot market and the set of hourly cassation prices that we have been witnessing. To get more insights about this, please read one of Magnus latest articles here.
In fact, the current Spot prices entered in a new range of prices and looking back in history, the behaviour of the price definition is nothing related to the energy mix.

Figure 8 -Energy Mix Evolution for Q1 and Q2 in Spain. SOURCE: OMIE

Figure 9 – Energy Mix Evolution for Q1 and Q2 in Portugal. SOURCE: OMIE
What the future holds?
As I, most of the market enthusiasts and observers are witnessing a market really uncertain and with no clear view about the upcoming months/year. We achieved a season point where the low spot prices are expected to be rare and where a small incident could impact greatly the market towards the months of more consumption (i.e. winter).
Europe is experiencing a dry and hot summer and forecasts do not predict any correction of the situation, at least until September. The temperatures above 30 ºC with countries like Sweden facing fires in their forests and with Lapland registering temperatures around the 33ºC are critical signs of climate change and are forcing some demand adaption to what can be called a heat wave. On the other hand, the Southern countries are experiencing a milder summer with Portugal with temperatures below the 30 ºC. This situation affects the demand downwards since less demand for cooling is required in Iberia.
The natural gas will play the most important role on the power prices in the coming months, in Spot and future markets. The current levels of the European strategic reserves will play a sensitive point of (ine)stability in terms of securing the supply needs for the winter of 18/19. Weather forecasts point for a milder and dry winter which could prevent spikes in the demand in normal conditions. However, any movement in terms of supply shortage due to bigger demand of LNG in Asia or punctual disruptions due to problems in Groningen or in the interconnections between North Sea and Europe could affect negatively the price of this commodity spreading to the power prices across Europe and, as consequence, affecting Iberia.
In the Peninsula we continue to be strongly dependent from the gas pipeline that connects Spain and Argelia, country that has been stable in the past years but where conflicts and instability as been growing in the borders with Mali and Libya. A possible disruption in the gas supply from this African country would aggravate the current price ranges for winter 18/19, similar to what happened in 2017.
Coal is expected to decrease greatly in Europe since measures in 2019 must be adopted to achieve the decarbonization goals but still, API2 is strongly related to what happens in Asia and China will probably maintain its internal fight between a drastic shift from coal to gas but consuming more imported coal than ever and India is increasing at a rapid pace its coal consumption which could pressured the price levels despite of smaller use of this fossil fuel in the Old Continent.
The last quarter of 2018 is witnessing the most expensive prices in history with an average price above the 67 €/MWh. The current levels of SPOT prices at 62 €/MWh in a not so hot summer in Iberia, with good levels of water to generate power and with normal participation of renewables which complicates our job to explain the current situation based only on the fundamentals.
The CNMC, the Spanish market regulatory entity, opened an investigation in order to evaluate the possibility of market manipulation. Although this investigation could cause a price correction in the coming months, the market rules and the way the market is designed allows this cost opportunity strategy that seems to be being adopted by the big utilities.
Prices for 2019 in Spain and Portugal are currently above the 56 €/MWh, 8 €/MWh more than the same period last year for Year+1 product and the upward trend repeats itself in all the European countries.

Figure 10 – Evolution of the Future Power Markets. SOURCE: MTECH
In Portugal, the discussions around the regulatory weigh in the energy prices, most of it attributed to the CAE and CMEC, have been occurring more often but I strongly believe that market enthusiasts and professionals should be spending their energy focusing on what’s happening in the market and in preparing their clients and businesses for the next year because 2018 is setting to be the most expensive year in the energy free market but the scenario expected for 2019 is preparing to be much worse.
Brace! Brace! Prepare for impact!
Jorge Seabra | Energy Consultant
If you found it interesting, please share it!
Recent Articles